
问题标题
如何解决在组合图中,上层面积图遮挡下层点图的问题?
问题描述
我在使用VChart创建了一个组合图,其中包含两个子图,子图类型都是面积图。因为第二个子图绘制在第一个子图的上面,所以它的区域会遮挡住第一个子图的数据点,使得第一个子图的数据点无法触发hover和click事件。我想问一问,有没有什么方法可以解决这个问题?
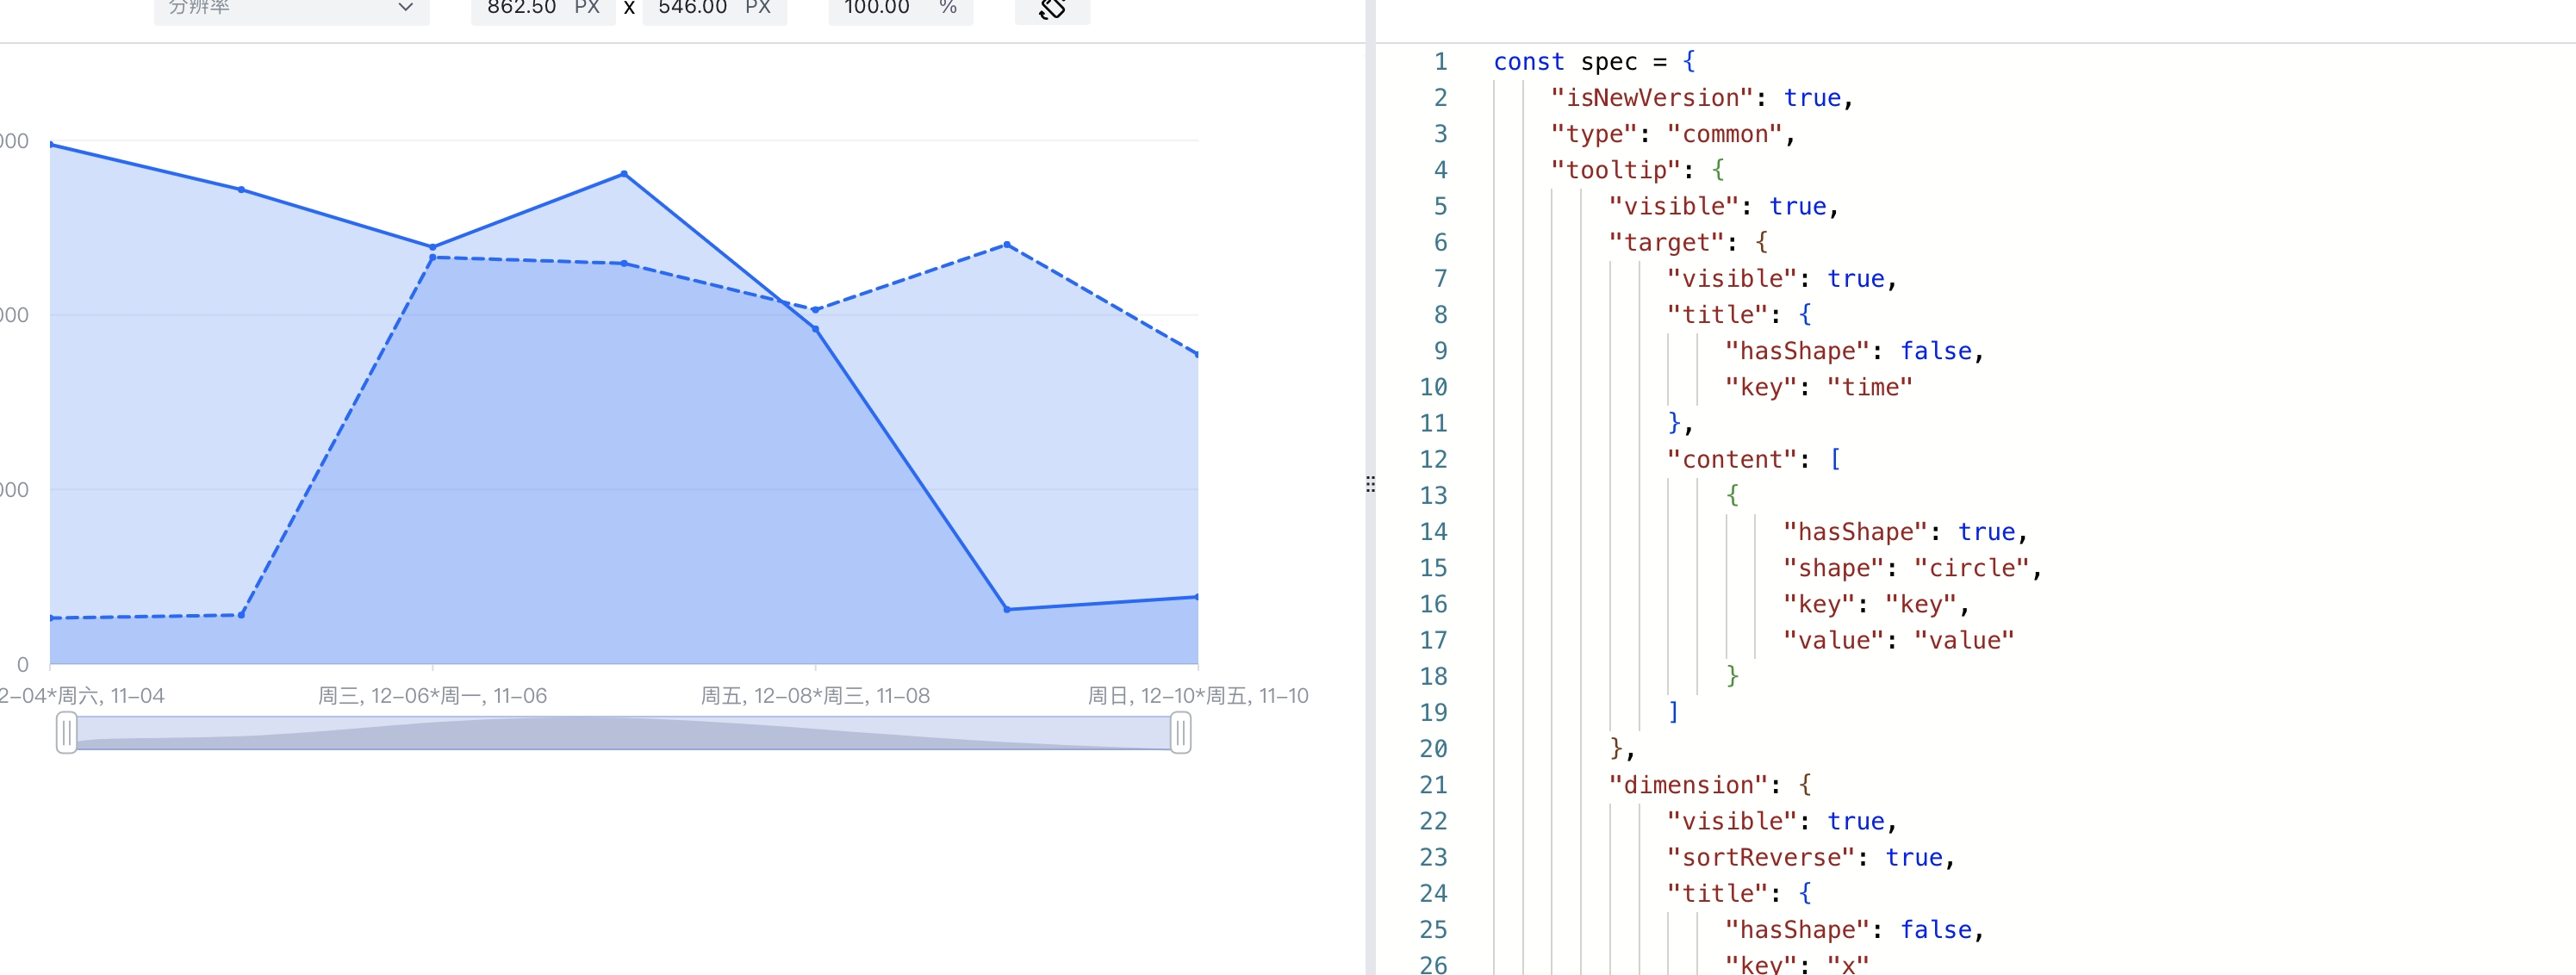
图表的配置如下:
const spec = {
*2*  "data": [...],
*3*  "series": [
*4*    {
*5*      "id": "area",
*6*      "type": "area",
*7*      "xField": "time",
*8*      "yField": "value",
*9*      "seriesField": "groupName",
*10*      ...
*11*    },
*12*    {
*13*      "id": "compare",
*14*      "type": "area",
*15*      "name": "compare",
*16*      "xField": "time",
*17*      "yField": "compareValue",
*18*      "seriesField": "groupName",
*19*      ...
*20*      "interactive": {
*21*        "line": false,
*22*        "area": false
*23*      }
*24*    }
*25*  ]
*26*}

const vchart = new VChart(spec, { dom: CONTAINER_ID });
vchart.renderAsync();</br>
解决方案
这个问题可以通过设置第二个面积图series的line.interactive和area.interactive属性为false来解决。配置如下:
{
"data": [...],
"series": [
{
"id": "area",
"type": "area",
"xField": "time",
"yField": "value",
"seriesField": "groupName",
...
},
{
"id": "compare",
"type": "area",
"name": "compare",
"xField": "time",
"yField": "compareValue",
"seriesField": "groupName",
...
"line":{
"interactive":false
},
"area":{
"interactive":false
},
}
]
}</br>
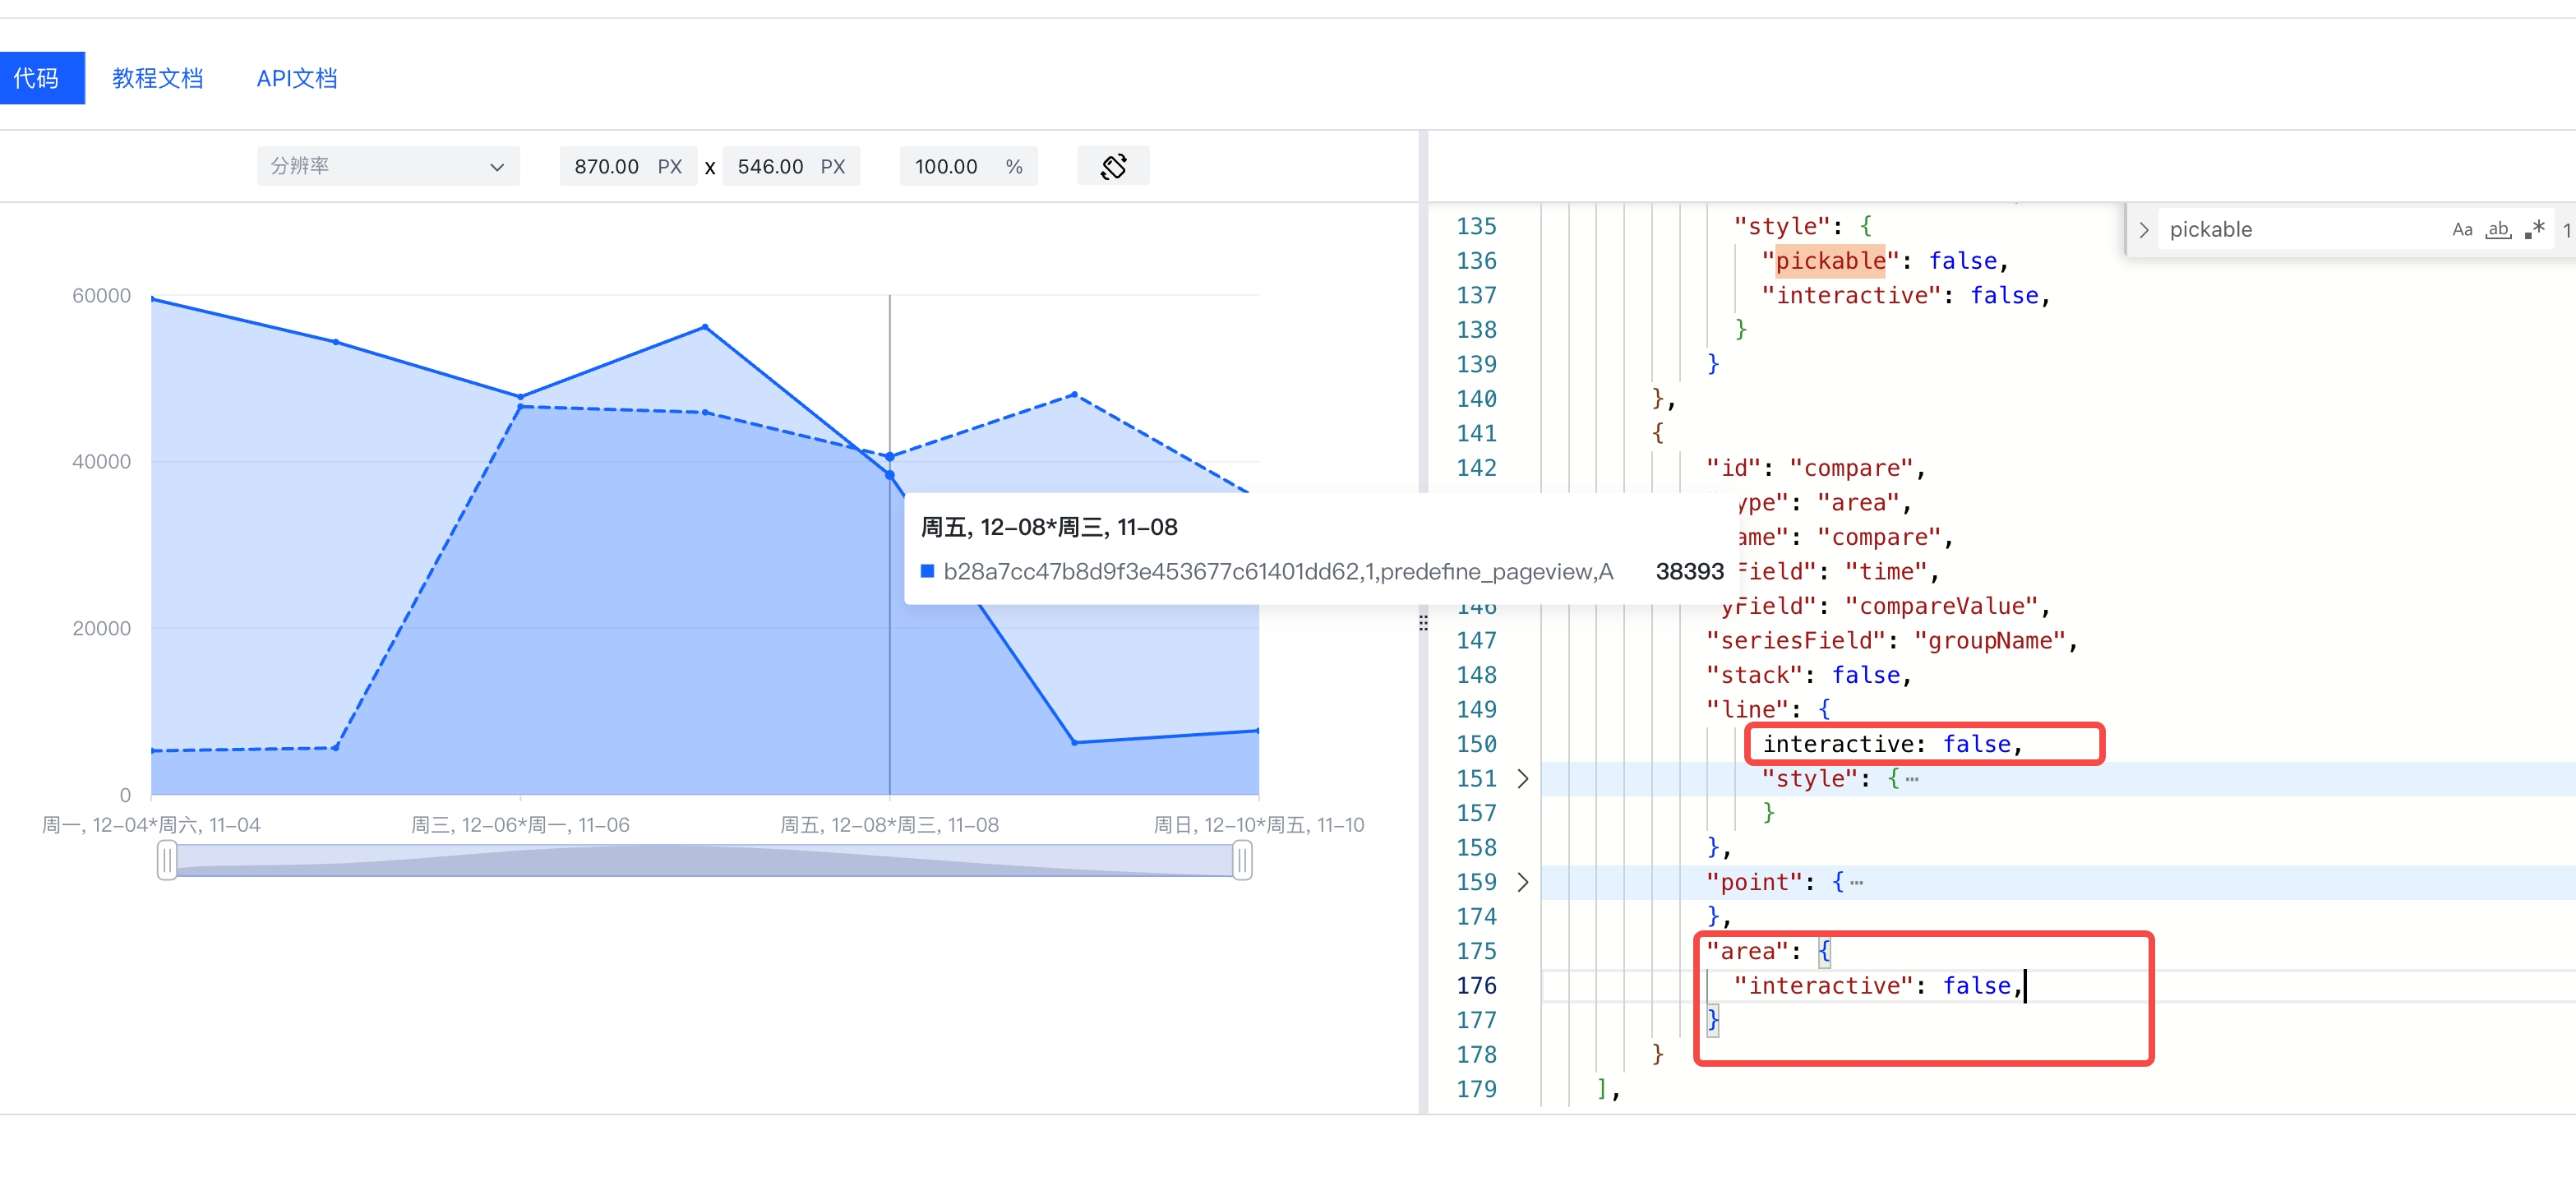
这样,第二个面积子图就不会响应交互事件,用户的hover和click事件可以透过第二个面积子图触发第一个面积子��图的数据点。
结果展示
使用上述配置,进行图表渲染,你会发现,第二个子图的线和面积图都不会再响应鼠标操作,这样就可以成功触发第一个子图的hover和click了。
在线效果参考:https://codesandbox.io/s/common-chart-interactive-jtmc92?file=/src/index.ts
相关文档
相关api:https://www.visactor.io/vchart/api/API/vchart
github:https://github.com/VisActor/VChart